10 Pandas tricks that can help you in data manipulation and analysis
-Anupam Shrivastava
1. Use iloc to select rows and columns:
You can use the iloc function to select rows and columns in a Pandas DataFrame using the index positions.
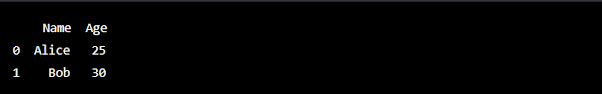
This code selects the first two rows and first two columns of the DataFrame using iloc, which returns a new DataFrame containing only those rows and columns. The resulting output will be:
Note that iloc uses zero-based indexing, so iloc[:2, :2] selects the first two rows and first two columns. You can also use iloc to select specific rows and columns based on their integer positions. For example, df.iloc[[0, 2], [1, 2]] selects the first and third rows and the second and third columns.
2. Dropna:
Use dropna function to remove missing values from a DataFrame.
The dropna function is a method in Pandas that is used to remove missing values (NaN) from a DataFrame. It can be used to drop rows or columns that have missing data, based on the specified axis.
Here's an example of how to use dropna to remove missing values from a DataFrame:
In the above example, the dropna function is used to remove rows with missing values from the DataFrame df. The resulting DataFrame df does not contain any missing values.
3. Groupby:The groupby function in Pandas is used to group rows of data together based on one or more columns, and then perform some aggregate function (e.g. sum, mean, count, etc.) on each group. Here's an example:
Suppose you have a DataFrame with information about sales transactions, including the date of the transaction, the item sold, the quantity sold, and the price:
To calculate the total sales for each day, you can group the data by the date column and then sum the quantity multiplied by the price:

The resulting daily_sales Series will have the total sales for each day:

4. Pivot Tables:
Pivot tables are a powerful feature in Pandas that allow you to summarize and aggregate data in a tabular format. They can help you gain insights into your data by providing a way to group and aggregate data across multiple dimensions.
To create a pivot table in Pandas, you can use the pivot_table() function. Here's an example:
This will create a pivot table with Region as the index, Product as the columns, and Sales as the values. The aggfunc parameter specifies how the data should be aggregated, in this case, the sum of the sales.
The resulting output will be:
This shows the total sales for each product in each region. Pivot tables can also be used to calculate other types of aggregates, such as averages or counts, and can be customized with additional parameters to further manipulate the data.
5. Apply:
The apply function is used to apply a function to each row or column of a Pandas DataFrame or Series. The function can be a built-in function or a user-defined function. The apply function is useful for performing complex operations on the data. For example, you can use the apply function to apply a lambda function to each row or column of a DataFrame.
Here's an example of how to use the apply function to apply a lambda function to each row of a DataFrame:
In this example, we create a DataFrame with three columns and three rows. We then use the apply function to apply a lambda function to each row of the DataFrame. The lambda function calculates the sum of each row. We specify axis=1 to indicate that we want to apply the function to each row. The result is a Series that contains the sum of each row.
6. Concatenate:
Concatenation refers to combining two or more data structures, such as Pandas DataFrames or Series, into a single object. This can be useful when you need to merge multiple datasets with overlapping or complementary data.
In Pandas, you can concatenate DataFrames or Series vertically (i.e., by adding rows) using the concat() function, and horizontally (i.e., by adding columns) using the merge() function.
For example, to concatenate two DataFrames vertically, you can use the following code:
This code will create two DataFrames df1 and df2 with two columns each, and then concatenate them vertically into a new DataFrame called concatenated_df. The resulting DataFrame will have six rows and two columns.
You can also concatenate DataFrames horizontally by adding columns. For example, you can use the following code:
This code will create two DataFrames df1 and df2 with two columns each, and then concatenate them horizontally into a new DataFrame called concatenated_df. The resulting DataFrame will have three rows and four columns.
Note that when concatenating horizontally, you need to specify the axis=1 argument to indicate that you want to concatenate columns rather than rows.
7. Merge:
The merge function is a powerful tool for combining data from two or more data frames based on a common column or index. It is similar to the JOIN operation in SQL.
Here is an example of how to use the merge function:
Suppose we have two data frames, df1 and df2, with the following data:
To merge these data frames based on the ID column, we can use the following code:
The resulting merged_df will be:
Here, we merged df1 and df2 based on the common ID column, and used an outer join to include all rows from both data frames. The resulting data frame contains all the rows and columns from both data frames, with missing values (NaN) where data is not present in one of the data frames.
The merge function is a powerful tool for combining data frames and is widely used in data analysis and manipulation tasks.
8. Reshape:
Reshaping in Pandas refers to transforming a DataFrame into a different shape, which can be useful for a variety of data analysis tasks. Pandas provides several functions to reshape a DataFrame, including:
pivot() and pivot_table(): These functions allow you to reshape a DataFrame by converting data from rows to columns or from columns to rows, based on the values in one or more columns.
melt(): This function allows you to reshape a DataFrame from a wide format to a long format, by "unpivoting" the data.
stack() and unstack(): These functions allow you to pivot a DataFrame by moving columns to rows or vice versa, based on the levels of a hierarchical index.
transpose(): This function allows you to flip the rows and columns of a DataFrame.
Reshaping a DataFrame can help in analyzing and visualizing data in different ways and can be especially useful when working with time series data or categorical data.
9. Stack and Unstack:
Stack and unstack are two Pandas methods used for reshaping data.
The stack() method pivots columns to rows, and the unstack() method does the opposite: it pivots rows to columns.
To better understand the concept of stack and unstack, consider the following example:
Suppose we have a DataFrame with two indices: 'A' and 'B' and three columns: 'X', 'Y', 'Z'.
The DataFrame looks like this:
If we apply the stack() method, the result will look like this:
Notice how the stack() method moved the columns X, Y, and Z to become rows. The resulting DataFrame has a multi-level index: the original indices A and B became the first level, and the stacked columns X, Y, and Z became the second level.
If we apply the unstack() method to the stacked DataFrame, we get back the original DataFrame:
The unstack() method moves the second level of the index (the stacked columns X, Y, and Z) back to become the columns of the DataFrame.
10. Crosstab:
Crosstab is a function in pandas that computes a cross-tabulation table of two or more variables. It is used to analyze the relationship between variables and summarize data in a tabular form.
The syntax of the crosstab function is as follows:
- index: the variable to group by on the rows
- columns: the variable to group by on the columns
- values: the variable to aggregate in the table (optional)
- aggfunc: the aggregation function to apply to the values (optional)
- margins: add row/column margins (optional)
- margins_name: name of the margin column/row (optional)
- dropna: whether to exclude missing values (optional)
- normalize: whether to normalize the table (optional)
Crosstab is a powerful tool for analyzing and summarizing data, especially when dealing with categorical variables. It can be used to create contingency tables, frequency tables, and more complex summaries of data.
These tricks can help you save time and simplify your data analysis process in Pandas.
I trust that you have gained valuable insights from my blog.
Wishing you a fulfilling learning journey!
Thank you for reading.
If you find my blogs informative and useful, please consider following me on
and YouTube (https://bit.ly/3Jd0gss). [ Like, Share, & Subscribe ]
By following you'll receive notifications directly whenever I publish articles/post/videos on Python, Data Science, Machine Learning, SQL and more.


Comments
Post a Comment